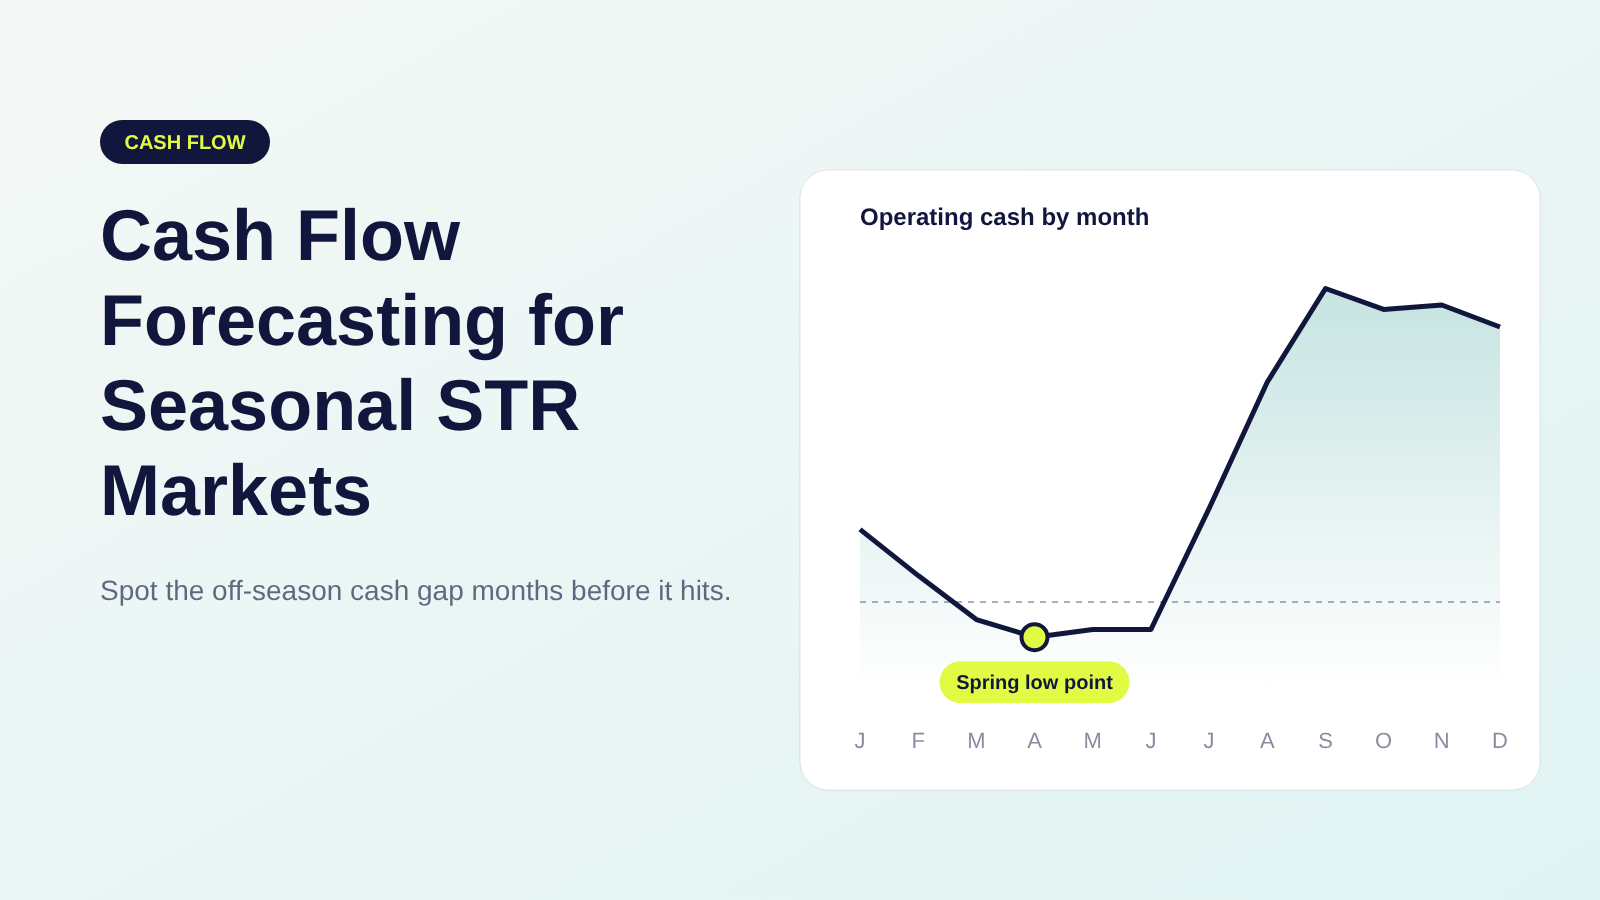
A step-by-step guide for vacation rental property managers to spot off-season cash gaps months before they hit.
In many summer-peak markets, a vacation rental management company's tightest cash month isn't January. It's spring. A seasonal cash flow forecast shows that gap before it hits. It predicts how much operating cash you'll have each week or month, built from bookings already on the books, the date commission actually reaches your operating account, and the fixed costs that keep running in the off season.
The timing surprises a lot of operators. Winter is slow, but the bills you pay in April are funded by commission earned in March, and March was quiet too. Meanwhile, summer deposits are piling up in your trust account, so your total bank balance looks healthier than it has in months.
This guide shows how vacation rental property managers build a forecast that catches that gap early: what to include, which reports to pull, and how to size the reserve that carries you to summer.
What Is a Seasonal Cash Flow Forecast?
A seasonal cash flow forecast is a forward-looking projection of cash in and cash out, built around the peaks and troughs of your market. For a property management company, it answers one question: will operating cash cover payroll, vendors and overhead every week between now and next peak season?
The math is the same one every finance team uses. Ending cash equals opening cash plus inflows minus outflows, and each period's ending balance becomes the next period's opening balance (Ramp). What changes in a seasonal STR business is when the inflows arrive, and how much of the cash in the bank is actually yours.
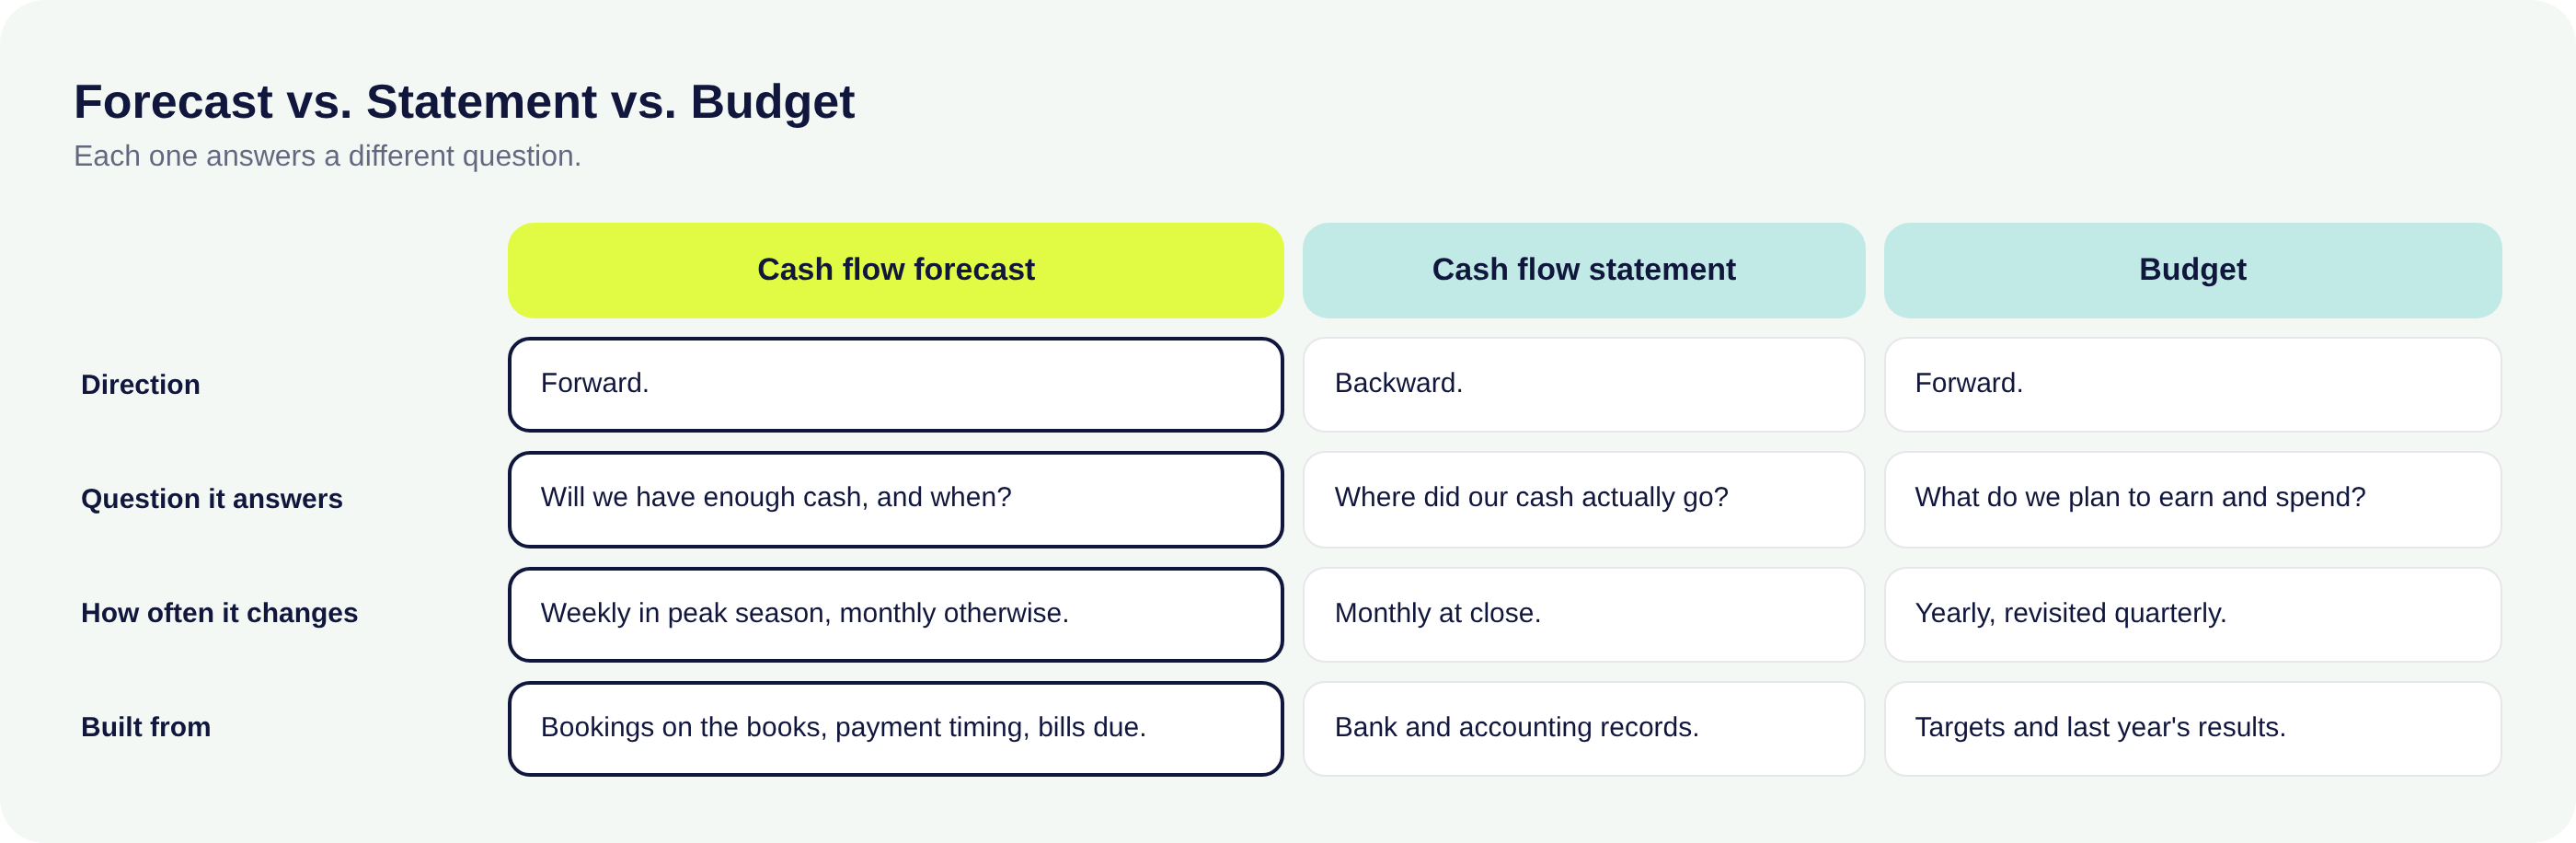
Forecast vs. Statement vs. Budget
These three get mixed up, and each answers a different question.
For the backward-looking side, our guide to cash flow analysis and free cash flow statement template cover it. This post is about looking ahead.
What Is the Spring Cash Trough?
The spring cash trough is the stretch, usually March through June in summer-peak markets, when operating cash hits its low point even though bookings are recovering. It happens because commission from slow winter months arrives after those months end, while overhead and preseason hiring ramp up before summer revenue lands.
Ski and mountain markets can see the same squeeze in late fall, after summer fades and before winter commission arrives. Markets with two peak seasons can have two troughs. The method below works the same way for all of them.
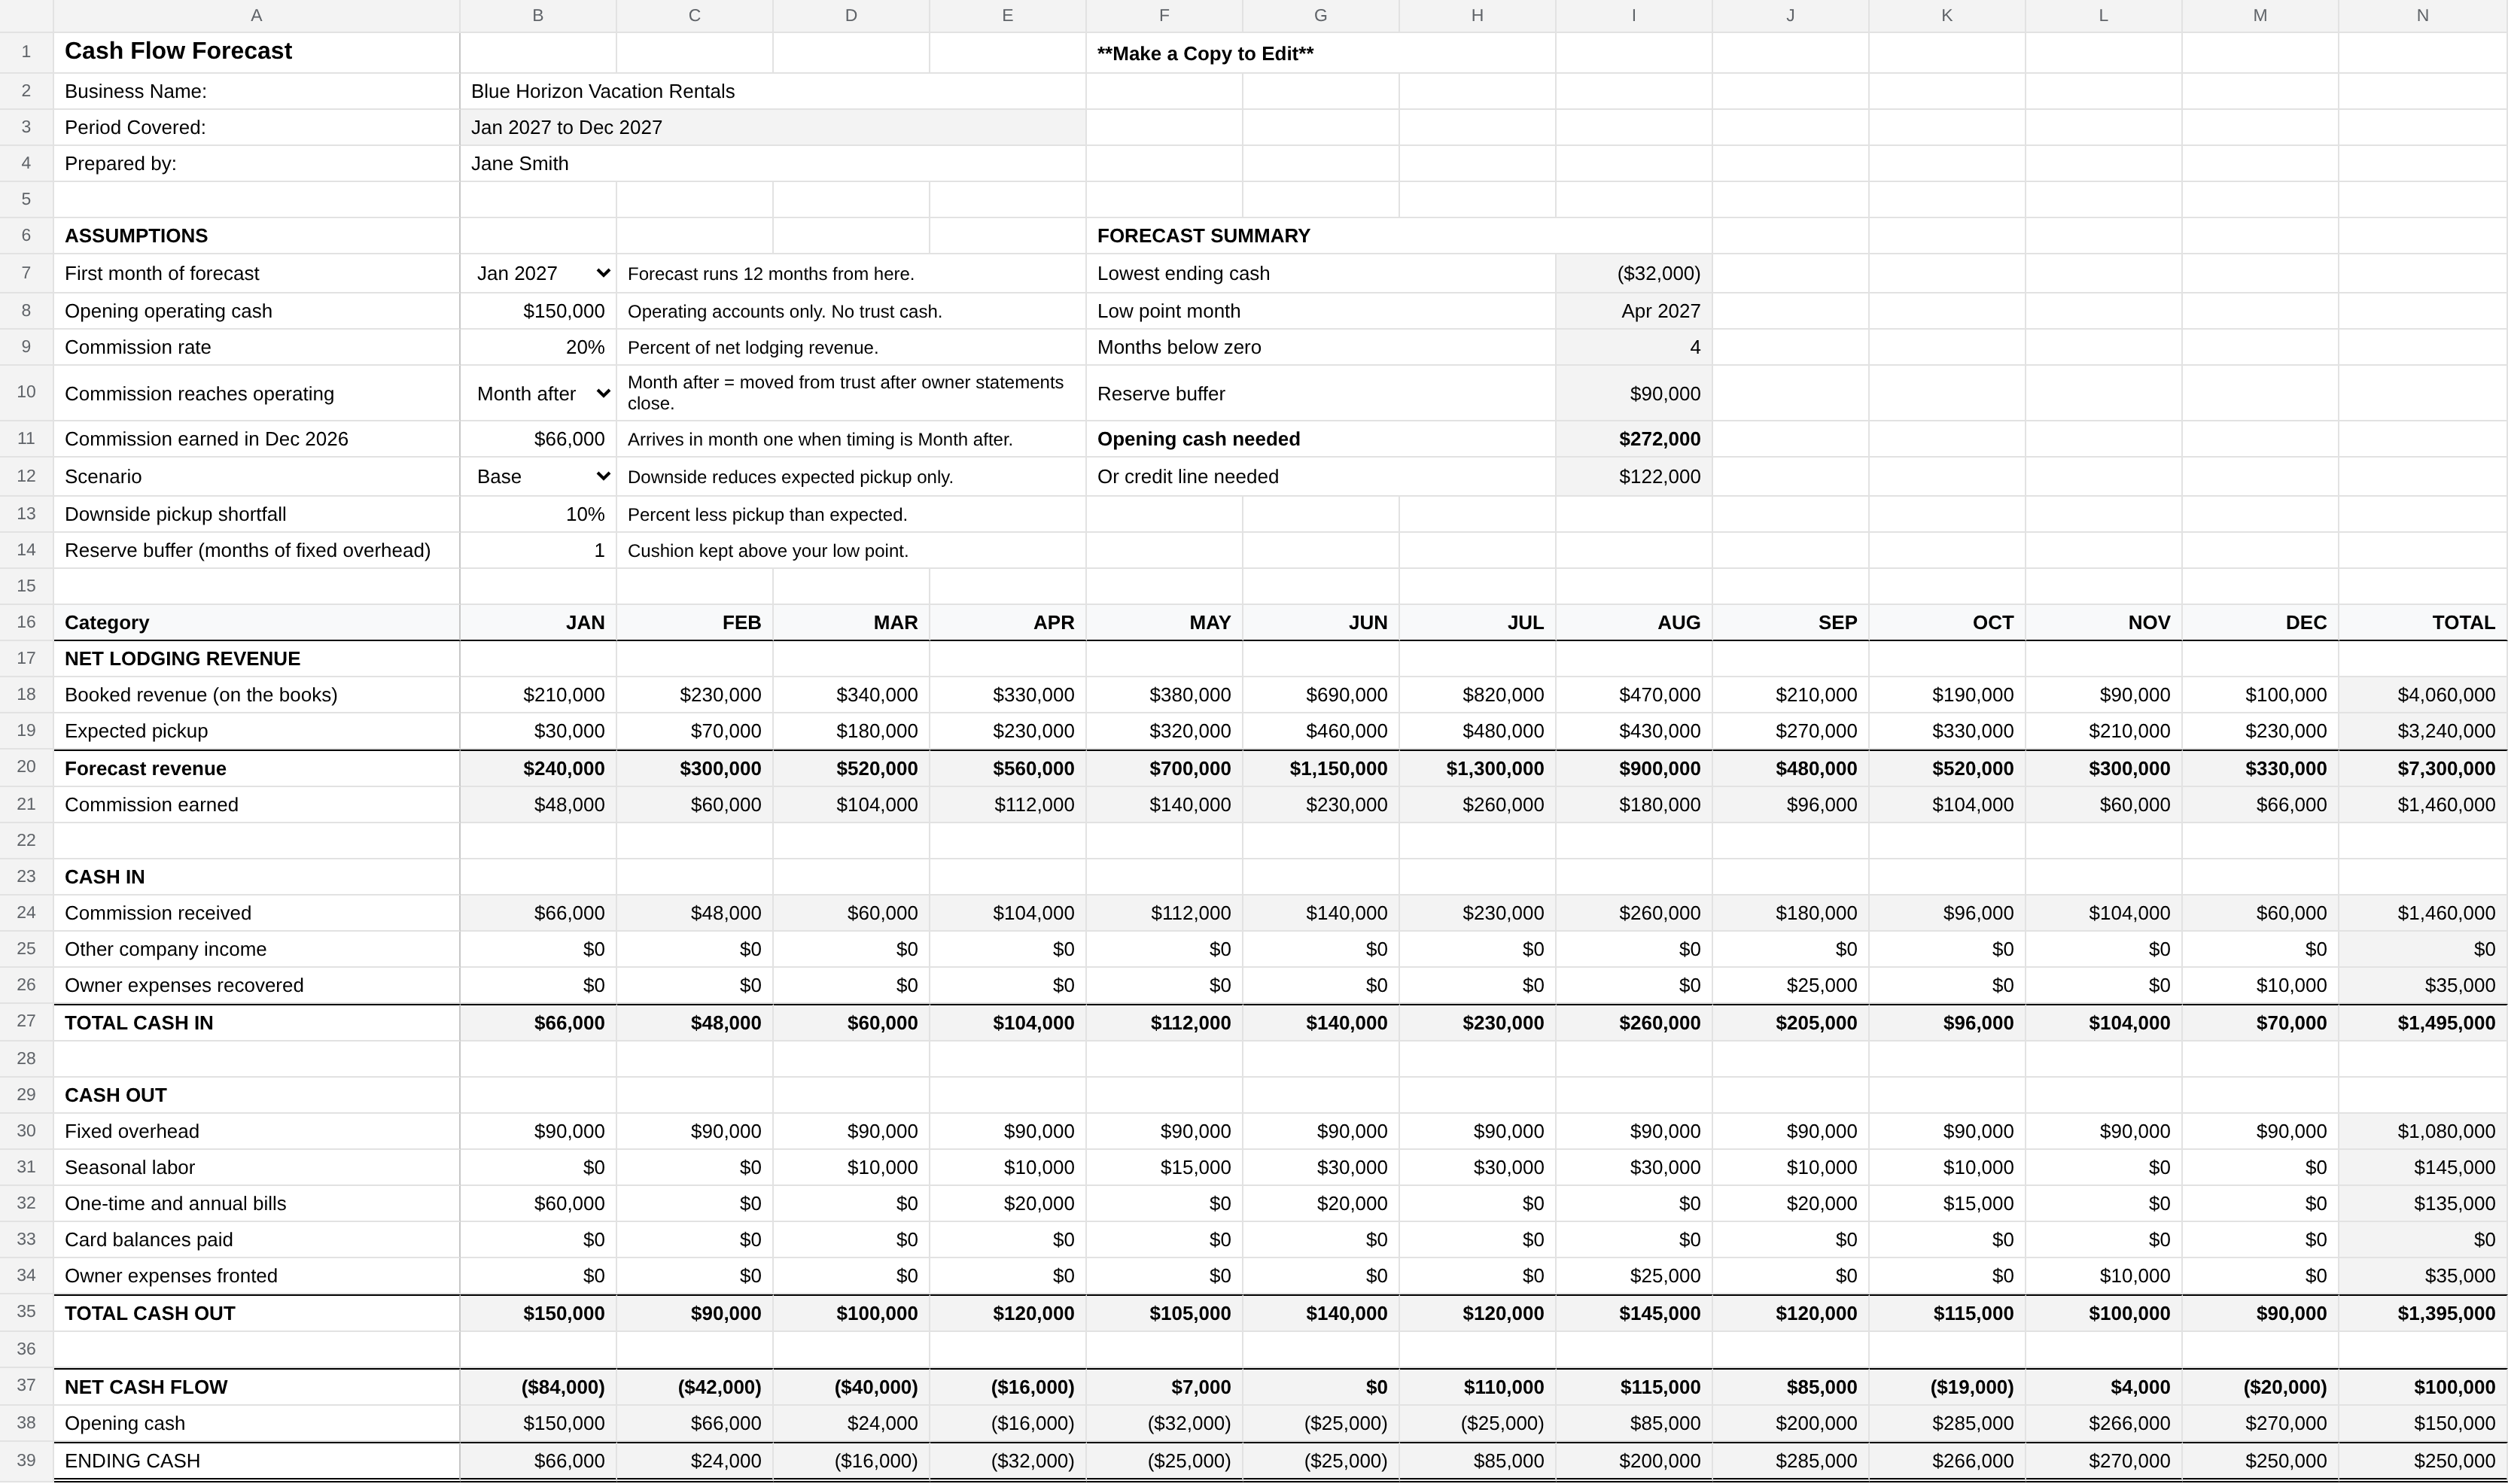
Here's an illustrative model of a 120-unit beach market management company. The numbers are built for this example, not taken from market data.
- $7.3 million in annual net lodging revenue, peaking at $1.3 million in July and bottoming at $240,000 in January.
- A 20% management commission, or $1.46 million a year.
- $90,000 a month in fixed overhead, plus $10,000 to $30,000 a month in seasonal labor from March through October.
- One-time bills: a $40,000 insurance renewal in January, $15,000 in annual software in October and $20,000 vendor contract payments in January, April, June and September.
- $150,000 in opening operating cash, with commission reaching operating one month after it's earned.
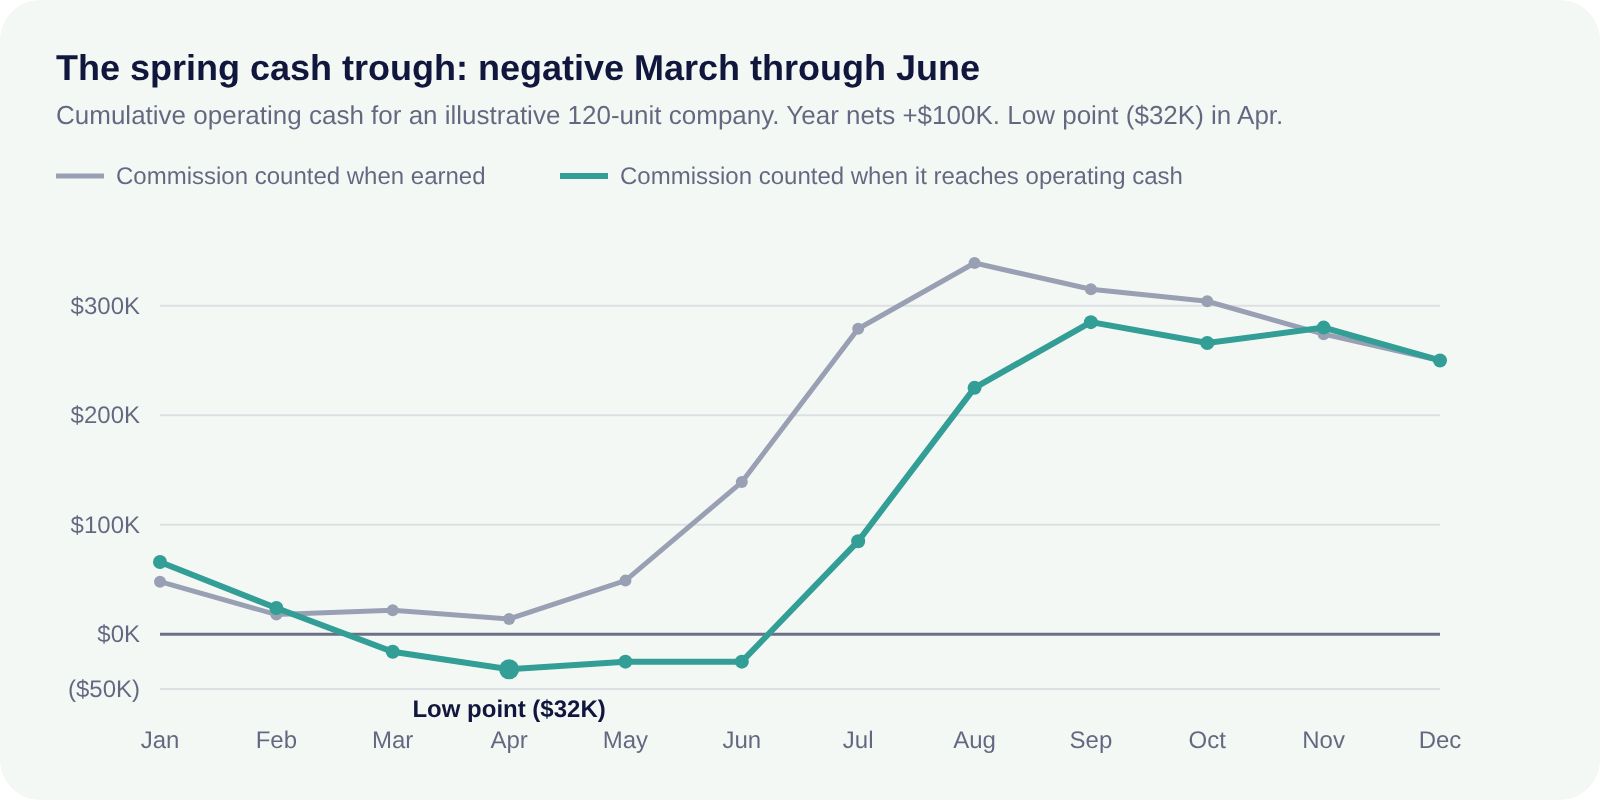
Counted when it's earned, this company never drops below $14,000. Counted when it actually reaches the operating account, it runs negative from March through June and bottoms at negative $32,000 in April. Same business, same year, same $100,000 net. The only difference is timing.
That gap is why a profit and loss statement can't stand in for a forecast. The P&L said the company was fine all spring. The operating account would have said otherwise in April.
Your numbers will differ in two ways. If you transfer commission at checkout or weekly, your lag is shorter and your trough will be shallower. If your company also keeps cleaning margin or guest fees, add them as inflows, and the trough softens further. Plug in your own timing and revenue lines. The shape is what matters.
Why Seasonal Markets Break Generic Forecasts
Generic forecasting guides assume revenue arrives when it's earned and that the cash in your bank belongs to you. Neither holds for a vacation rental management company in a seasonal market.
Your Costs Stay Flat While Commission Swings
Occupancy and nightly rates fall in the off season, but office rent, salaries and software don't. Peak months have to generate the surplus that carries the business through the slow ones (Hostaway). A forecast that averages the year hides exactly the months you need to see.
Commission Arrives after the Stay
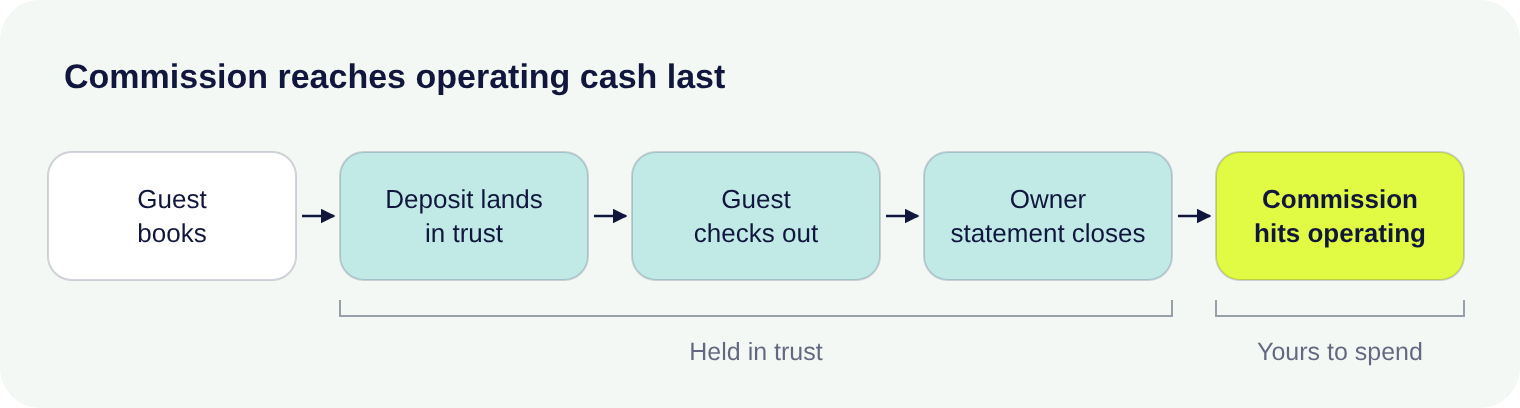
Your management commission isn't spendable when a guest books. Depending on your PMS settings, it's recognized across the nights of the stay, at check-in or at checkout (Hospitable). Many managers then move it to operating after the monthly owner statement closes.
That can put several weeks between a stay and the cash it produces. In a slow month, the lag barely matters. Coming out of a slow season, it decides whether you can make payroll.
Trust Balances Make You Look Richer
Before peak season, advance rent and deposits flow into your trust account. That money belongs to guests and owners until stays happen and statements close. If you don't track advance deposits separately, your bank balance can give you a false sense of your cash position right when you need to plan for the slow season.
Keep trust cash out of the operating forecast entirely. Track it in its own view if you like, but never let it cover an operating shortfall. Our guide to trust accounting covers the rules in more detail.
How Far Ahead Should You Forecast?
Use two forecasts: a 13-week rolling forecast for near-term cash and a 12-month forecast for the seasonal shape. The 13-week view is the standard short-term treasury tool because it covers a full quarter while still catching weekly dips (Ramp). The 12-month view shows the trough coming while there's still time to act.
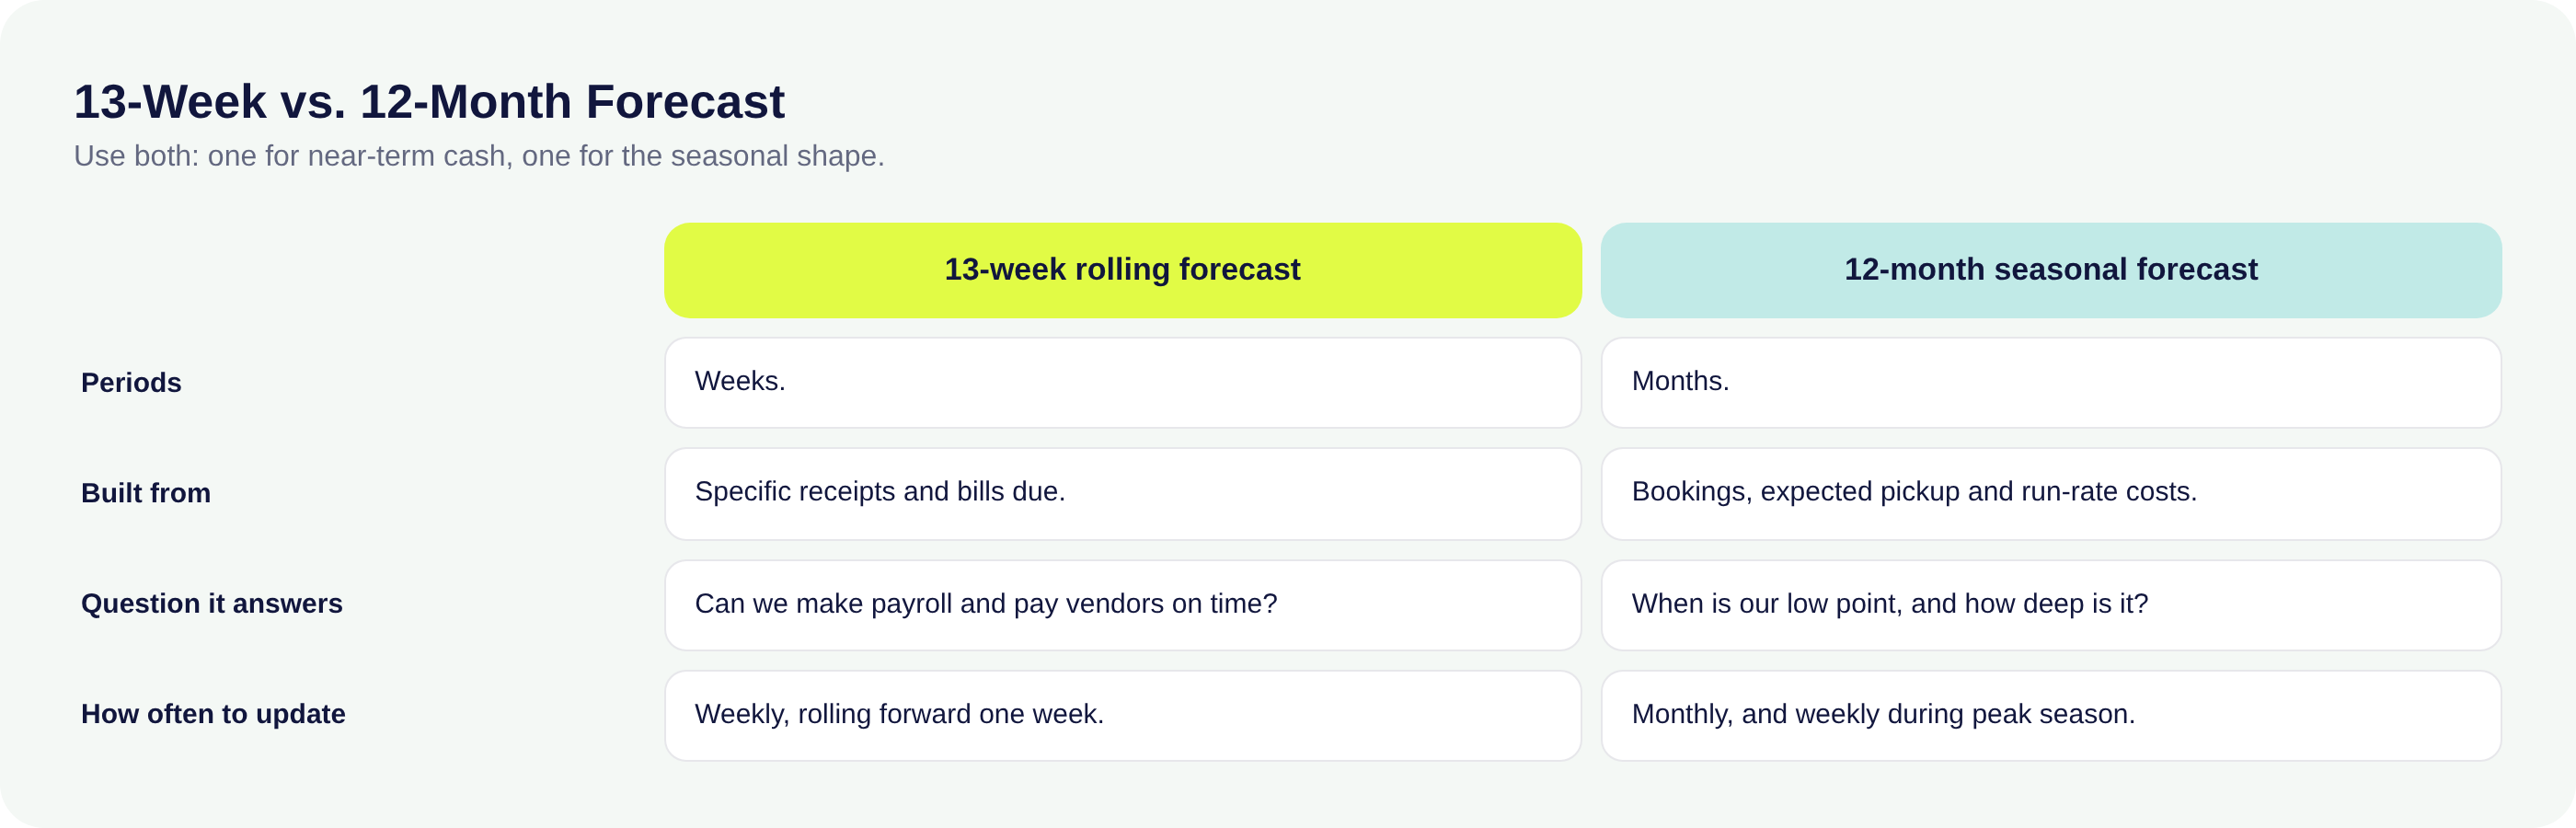
Ramp notes that seasonal and hospitality businesses often move to weekly projections during peak periods. For STR managers, the weeks leading into and out of peak season deserve the same attention.
How to Build a Seasonal Cash Flow Forecast
Seven steps take you from raw booking data to a forecast you can act on. Each step ends with the report to pull.
Step 1. Map Your Seasons
Start with two to three years of your own monthly revenue to establish your peak, shoulder and off seasons (PriceLabs). Divide each month by your average month to get a seasonality index. In the example above, July's index is about 2.1, meaning July brings in a bit more than twice an average month.
What to pull: monthly net lodging revenue by market from your PMS.
Step 2. Start from On-the-Books Revenue
On-the-books (OTB) revenue is the rent from confirmed, non-cancelled future reservations as of today. Compare it with what was on the books for the same stay month on the same date last year, known as same time last year or STLY. That comparison is your pace (RedAwning).
Pace isn't a forecast, though. It tells you whether you're ahead of or behind last year's path, not where the month will finish. Compare same-store units only, because units added since last year make the whole portfolio look ahead of pace.
What to pull: a reservation export with booking date, arrival date, rent and cancellation date. Save a dated copy every week.
Step 3. Forecast Pickup for Each Month
Pickup is the revenue added between two snapshots. To estimate where a month will finish, add last year's remaining pickup for that month to today's OTB, then adjust for what's different this year.
Here's how that works for one month, with illustrative numbers. Say July has $820,000 in rent on the books today. Last year on this same date, July had $760,000 on the books and finished at $1.25 million, so $490,000 arrived after this point. Today's $820,000 plus $490,000 of expected pickup gives a starting forecast of $1.31 million for July.
Booking windows matter most. When guests book later than they did last year, you look behind early and catch up late. Read early pace too literally and you could cut rates you didn't need to cut.
Holidays and channels shift results too. Easter moves from April 5, 2026 to March 28, 2027, pulling spring break demand from April into March (RedAwning). A new booking channel adds reservations that didn't exist last year, so split pace by channel before reading it.
What to pull: last year's pickup by stay month, from saved snapshots or rebuilt from booking and cancellation dates.
Step 4. Convert Bookings into Your Inflows
Your forecast tracks the company's cash, not the guest's payment. Strip out OTA fees, lodging taxes and pass-through cleaning fees to get net lodging revenue, then apply your commission rate. Add the fees and margins your company keeps, such as a cleaning margin if your team handles turnovers. Our break-even framework walks through this gross-to-net math step by step.
What to pull: commission rates and fee terms from your management agreements.
Step 5. Shift Inflows to When Cash Arrives
This is the step most forecasts skip. Place each month's commission in the period it actually reaches your operating account, not the month it was earned. Match your PMS recognition setting and your owner statement schedule. Hospitable, for example, recommends prorated recognition for commission so revenue lines up with the nights stayed.
Inflows can also arrive late or short. A payment processor may hold back a rolling reserve, an OTA can hold a payout or claw back a resolution from another property's payout, and bank transfers can take several business days. In the 13-week view, place each inflow on the day it actually lands, and leave held funds out until they're released.
What to pull: your PMS commission recognition setting and your month-end close and owner payout calendar.
Step 6. Add Every Outflow
Group outflows into three buckets. Fixed overhead covers salaries, rent and software. Seasonal costs include preseason hiring and peak housekeeping labor. One-time bills are the easiest to forget: insurance renewals, annual software contracts, quarterly vendor payments and furniture refreshes.
Two outflows catch seasonal operators off guard. Card balances run up during peak months often come due in full a month later, just as the season slows. And expenses you pay on owners' behalf, such as repairs and restocks, leave your account now but come back only when the owner statement closes, or later if an owner's balance runs negative. Date every outflow by when the money leaves your account, not by the bill date.
A blank spreadsheet is enough to build the forecast. Give each month its own column and use these lines as rows, in this order. Each month's ending cash becomes the next month's opening cash.
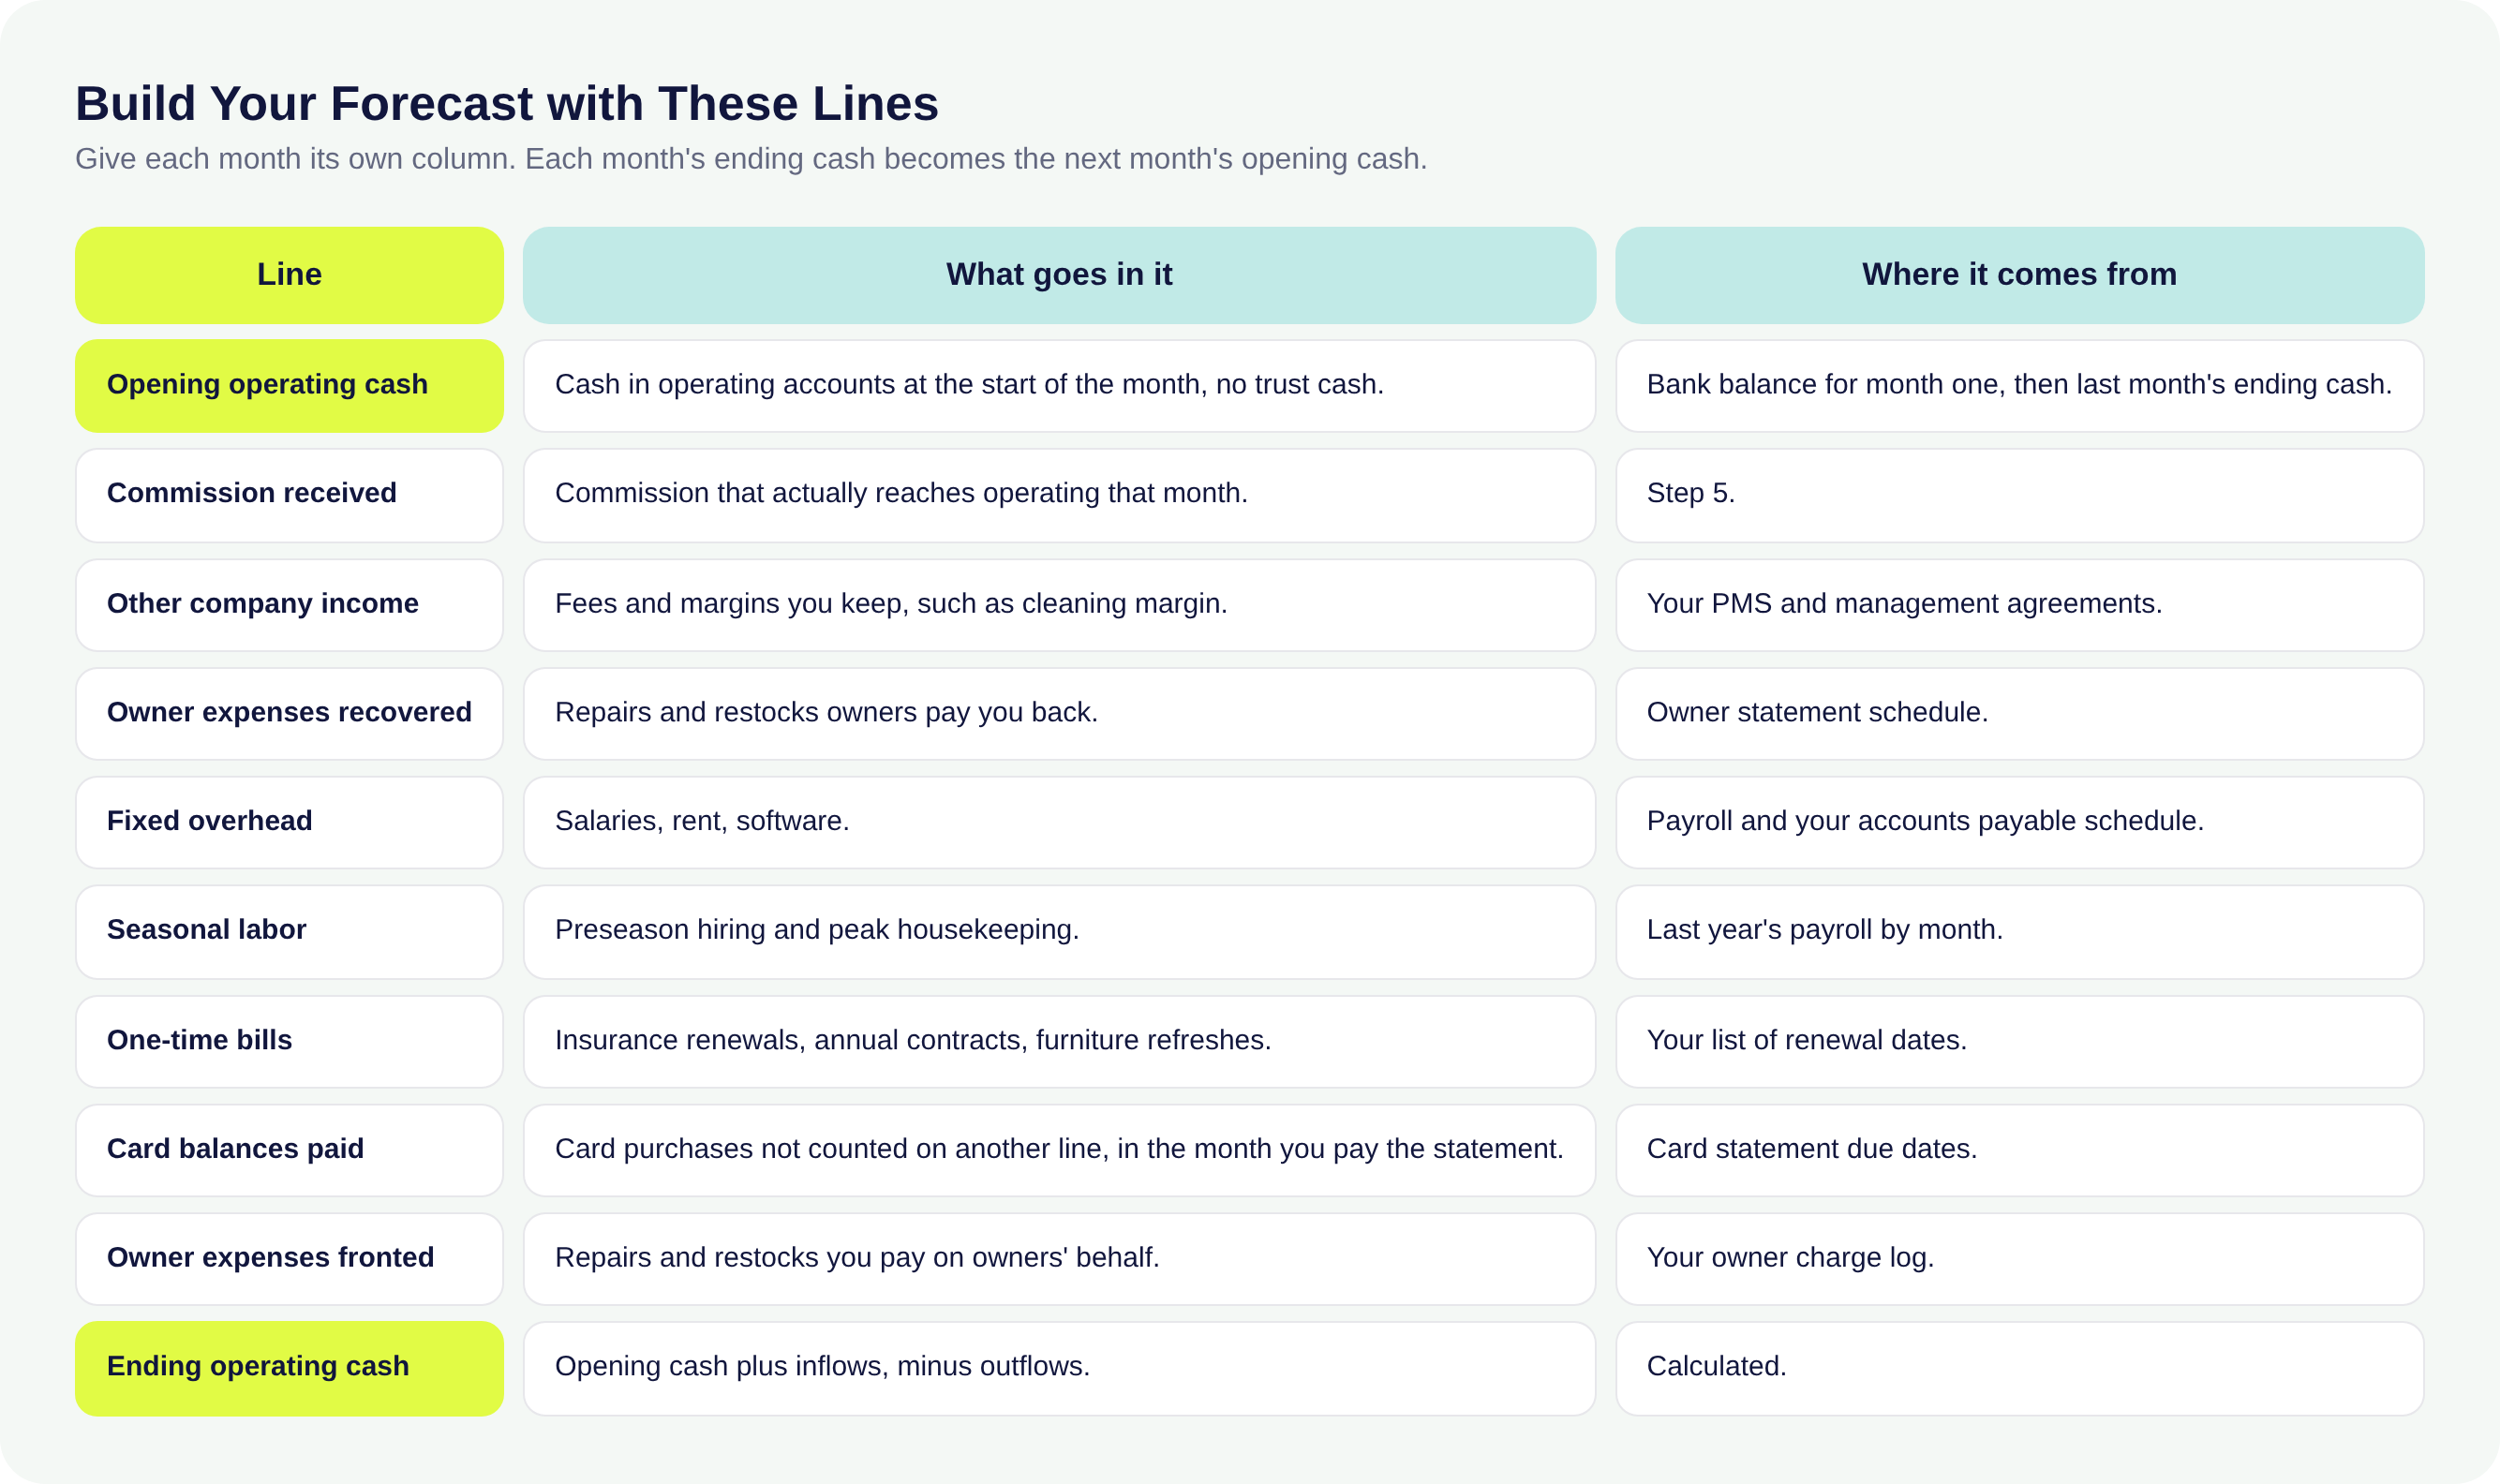
What to pull: payroll, your accounts payable schedule and a list of annual renewal dates.
Prefer to start from a working version? Our free Cash Flow Forecast Template does this math for you and comes filled in with the example from this guide.
Step 7. Find and Test Your Low Point
Roll the balance forward and find the lowest point. That number drives your reserve and any decision about a credit line.
Then run three cases: a base case, a downside where pace runs 10% behind, and an upside. Review stay dates in the next 90 to 120 days weekly and later months monthly (RedAwning). Compare each forecast with what actually happened, so your assumptions get sharper every month.
How Much Cash Reserve Do You Need?
A common rule of thumb is two to three months of operating expenses. A forecast lets you be more precise: cover the forecast's lowest point, then add a buffer for what the forecast can't see.
In the example, operating cash bottoms at negative $32,000. Covering that gap plus one month of fixed overhead ($90,000) as a buffer means starting January with about $272,000 in operating cash instead of $150,000, or having a credit line in place before March. The safety cushion section of our break-even framework covers how seasonality, payout lag and portfolio concentration should shape that buffer.
Five Seasonal Forecasting Mistakes to Avoid
Most forecasting misses in seasonal markets come from the same five habits. Each one makes cash look better than it is.
Forecasting from Gross Bookings
Gross booking value includes OTA fees, lodging taxes and the owner's share. Forecasting from it can overstate your company's inflows many times over. Start from your commission and the fees you keep.
Counting Trust Cash as Yours
Advance deposits make the bank balance look strongest right before the spring trough. Keep trust balances out of the operating forecast, so a healthy-looking total doesn't hide an operating shortfall.
Ignoring the Commission Lag
Placing commission in the month it's earned hides the trough completely, as the example shows. Use the date cash reaches your operating account.
Forgetting Quarterly and Annual Bills
Insurance renewals, annual contracts and card balances from busy months often land in slow months. Put every renewal date on the forecast, because one missed $40,000 bill can turn a thin month negative.
Fronting Owner Expenses without a Payback Date
When you pay a repair or restock for an owner, the cash leaves now and comes back only when the owner statement closes. If the owner's balance runs negative, it may not come back that month at all. Forecast fronted expenses as an outflow and their recovery as a later inflow.
Frequently Asked Questions
How Often Should I Update My Forecast?
Update the 13-week forecast every week, rolling it forward one week at a time. Update the 12-month forecast at least monthly, and weekly in the months leading into and out of peak season. Each time, compare the last forecast with what actually happened and adjust your pickup assumptions.
How Do I Forecast Units without Booking History?
Start from last year's results for comparable units in your portfolio, or from market data for similar properties, and keep the assumptions conservative until the units have a full season of their own. Leave new units out of your pace comparison, which should cover same-store units only.
Should I Forecast on a Cash or Accrual Basis?
Forecast on a cash basis, even if your books are kept on an accrual basis. Your P&L may record commission when stays happen, but your forecast should record it when it reaches your operating account. Date every inflow and outflow by when the money actually moves.
What If My Forecast Goes Negative?
Act before the first month below zero. Line up a credit line sized to the shortfall plus your buffer, move one-time bills out of the low months where contracts allow, recover fronted owner expenses on the next statement and hold discretionary hires until the trough passes. Where your management agreements and state rules allow, transferring earned commission at checkout or weekly also shortens the lag.
How Do I Forecast a Two-Season Market?
Forecast all 12 months the same way, then look for more than one low point. Ski and mountain markets often run a summer season and a winter season, with a trough after each. Size your reserve to the deeper trough, and watch late fall closely, since winter hiring can start before winter commission arrives.
Start Your Forecast This Week
Pull your reservation export, save your first on-the-books snapshot and sketch the next 12 months of operating cash. The spring trough is far easier to plan for in November than to fix in April.
About Topkey: Topkey is the leading financial automation platform built specifically for vacation rental managers. Integrating directly into your PMS and accounting software, Topkey provides a single, unified system that automates expenses, bookkeeping, receipts, banking, corporate cards, AP/bill pay, and more.
Topkey helps you increase profitability by eliminating cash leakage and automating time-consuming financial workflows. As the only expense platform in the property management industry with direct integrations to Visa, American Express, and Mastercard, Topkey delivers unmatched accuracy, flexibility, and confidence over your expenses.
Benefits include:
- Simplify Accounting: Close your books faster and generate owner statements easier with better financial visibility and control.
- Save Time: Capture receipts and sync expenses to your PMS and accounting software in 1-click.
- Cut Leakage: Catch every expense and uncover missed reimbursable owner charges.
- Consolidate Systems: Manage credit cards, banking, expenses, and bill pay all in one place.
- Automate Processes: Get your team's time back so they can focus on scaling, not admin work.
See what our customers say about using Topkey at topkey.io/customers.
Related reading: break-even analysis framework, cash flow analysis for managers, trust accounting in property management, free cash flow statement template.
See the Topkey difference.